


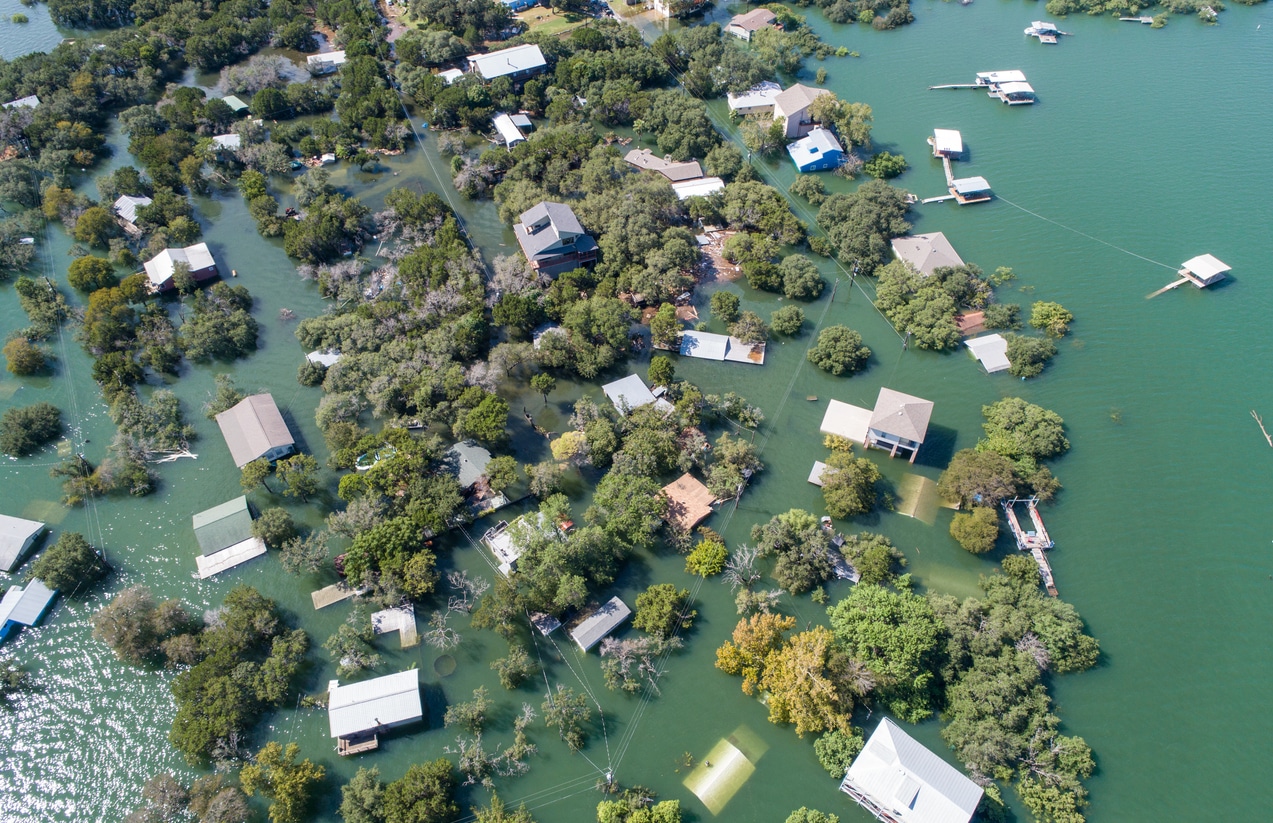
The maps from nonprofit First Street Foundation highlight the widespread nature of flood risk. Flooding caused about $17 billion in property damage a year from 2010 to 2018, according to the Association of State Floodplain Managers.
Homeowners, developers and city planners have long used the Federal Emergency Management Agency’s flood maps, which outline flood zones. FEMA’s maps label which properties have at least a 1% annual risk of flooding, also called a 100-year flood zone.
Rising Tides
According to analysis done by First Street Foundation, nearly every state is more at risk for flood damage than FEMA currently documents.
FEMA classifies 8.7 million properties as having a 1% annual flood risk, according to First Street, while First Street’s maps put 14.6 million properties into that category, or about 10.3% of all properties in the contiguous U.S.
The organization, which advocates for providing homeowners with more information about flooding and climate change, said its maps show more properties with 1% flood risk than the FEMA maps because it includes parts of the country that FEMA hasn’t mapped, uses current climate data and incorporates rainfall-related flooding.
FEMA said in a statement that its maps are intended for floodplain-management and emergency-response decisions. “The FEMA Flood Insurance Risk Maps and First Street Foundation maps do not conflict with each other, rather they complement one another by depicting different types of risk,” FEMA said. “Users should explore the differences between the maps to build a more comprehensive understanding of flood risk.”
First Street is making its flood-risk data, including a 1-to-10 score for each property in the contiguous U.S., available free to consumers. Its data also includes projections for how each property’s flood risk might change in the next 30 years, based on climate models.
Some of the biggest gaps between the First Street and FEMA maps are in inland states. In Utah, Montana and Wyoming, First Street said it identified more than four times as many properties with 1% annual flood risk than FEMA’s maps show. In highly flood-prone states such as Florida and Texas, the relative gaps are much smaller.
In Louisiana, Arizona and New Jersey, First Street said it identified fewer properties with 1% flood risk than FEMA’s maps.
First Street also projected that by 2050, the total number of contiguous U.S. properties with a 1% annual flooding risk will increase to 16.2 million, or 11.4% of total properties.
Many counties in the U.S. aren’t mapped by FEMA, and in about 3,300 communities, the maps are more than 15 years old, said Michael Grimm, FEMA’s assistant administrator for risk management for the Federal Insurance and Mitigation Administration, in testimony at a February congressional hearing. FEMA’s maps also don’t reflect projected future sea-level rise or expectations for increased rainfall in some areas due to climate change.
“FEMA’s maps are a snapshot in time, and some of those snapshots fade in time,” said Roy Wright, chief executive of the Insurance Institute for Business & Home Safety and the former chief executive of the National Flood Insurance Program.
In the past three years, more than 40% of flood claims have been for properties that are unmapped by FEMA or outside FEMA’s 1% annual risk zones, according to Mr. Grimm’s testimony.
Who’s at Risk?
FEMA flood zone maps have become the de facto source of flood risk information for homeowners, even though many have not been updated in a decade.
“We have a lot more flood risk in the country than we currently understand,” said Chad Berginnis, executive director of the Association of State Floodplain Managers.
Still, Mr. Berginnis cautioned that the thousands of local floodplain managers around the country hadn’t seen First Street’s maps and might disagree with the methodology. “The ground-truthing of this is going to become very important,” he said.
Scott Kozicki’s house in the Bellevue neighborhood of Nashville, Tenn., didn’t have flood insurance when it was destroyed by the city’s catastrophic flooding in May 2010. It took him years to rebuild. He now has flood insurance on the property, even though it isn’t required.
“The flood was the most devastating thing I’ve ever seen,” he said.
In Tennessee, First Street identified about 383,000 properties with at least a 1% annual flood risk, while FEMA puts about 101,000 properties in that category, according to First Street. In Davidson County, where Nashville is located, First Street said 10% of the properties have at least a 1% annual flood risk, compared with about 3% on the FEMA maps.
The Nashville area’s FEMA flood maps were redone in 2017, and parts of them were updated again this year, said Roger Lindsey, practice leader for stormwater and floodplain management for the Metropolitan Government of Nashville and Davidson County. He said he didn’t know what methodology First Street used, but “our city would be hard-pressed to be more up-to-date than we are at this point.”
Still, Mr. Lindsey said he thinks it is helpful to give homeowners more information about flood risk.
“I hear people all the time say, ‘I’m not in the flood plain so I don’t need flood insurance,’” he said. He advises people outside the 1% risk zone to purchase flood insurance “if you’re close enough to see the creek in the distance or the river in the distance.”